The Oregon Health Authority Says, “An Error” Caused Dashboard Vaccine Percentage Numbers To Go Down
Portland, Ore. — After several days of questions from KXL, the Oregon Health Authority Thursday said there is an issue with historical data one of the states COVID Dashboards, but the overall numbers are correct.
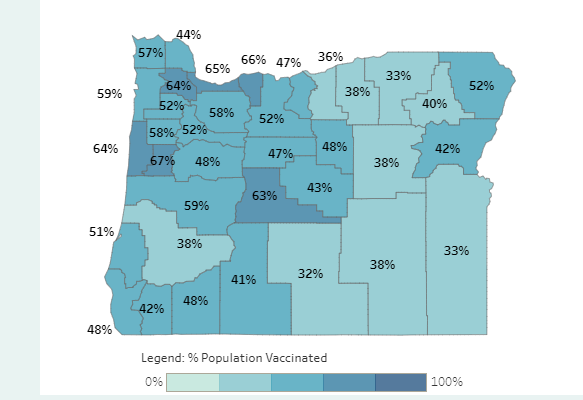
After the Governor announced on May 11th, that counties which reach a 65% vaccination rate could apply to move to the Lower Risk level, KXL looked closely at Multnomah and Washington counties as they were the two closest in the Portland area to moving forward. When the dashboard that tracked this information was updated on May 17th, the percentage numbers for past days had gone down. That same issue happened again on May 18th, May 19th and yet again on May 20th.
During the afternoon of May 20th, KXL spoke with the COVID-19 Vaccine Planning Unit Data and Allocations Lead, Rex Larsen. To told us that there was an error causing what we were seeing.
Thank you for catching the error in our dashboard that was causing historical immunization rates to change. The changes were from people who had initiated vaccination being subtracted from that number when they went on to complete their vaccination series at a later date. So they continue to contribute to the total vaccinated number on the present day for that county, but were subtracted out of the historical in “progress data”. It made it appear, if you went back and looked at historical dates, that the number of people “in progress” was actually shrinking with each day as those people moved to “series complete” on a later day.
The display issue doesn’t impact the current county vaccination rates, and all of those people being subtracted from historical dates still contribute to the total. This error unfortunately has coincided with falling demand throughout the state from it’s peak in April. It would have made it more complicated to tell the story of why some counties took longer to reach the governors goal than predicted based upon their historically high administration rates. We’re working on updating our dashboards to correct this issue so that historical data is properly displayed.
Here’s a link to the governors goal dashboard that is the best place to track county vaccination rates.
Despite the historical numbers going down, the OHA claims the overall numbers are still correct.
KXL will continue to look at all of the information and try to ensure the public is kept informed on the latest regarding COVID-19 and the State of Oregon’s response.