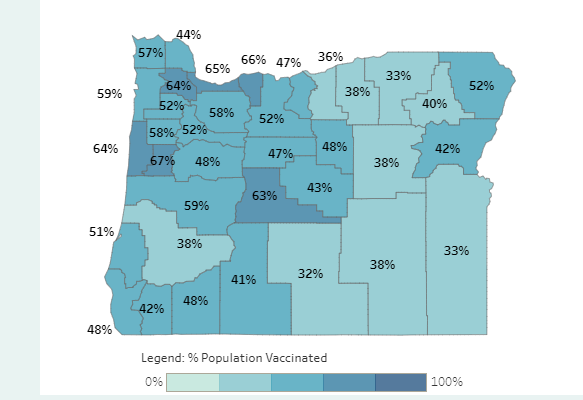
UPDATE: Oregon County Vaccination % Goes Down For A Second Day In A Row.

UPDATE:
On Tuesday morning, we looked at the OHA website again to see the new numbers and once again, the numbers went down.
Washington County:
| May 11 | May 17 | May 18 | |
| May 1 | 51.9% | 47.7% | 47.2% |
| May 2 | 53.0% | 48.9% | 48.3% |
| May 3 | 54.4% | 50.2% | 49.7% |
| May 4 | 56.0% | 51.8% | 51.3% |
| May 5 | 57.3% | 53.1% | 52.6% |
| May 6 | 59.0% | 54.9% | 54.4% |
| May 7 | 60.2% | 56.3% | 55.8% |
Multnomah County:
| May 11 | May 17 | May 18 | |
| May 1 | 53.2% | 49.0% | 48.4% |
| May 2 | 54.4% | 50.2% | 49.6% |
| May 3 | 56.0% | 51.8% | 51.2% |
| May 4 | 57.4% | 53.2% | 52.6% |
| May 5 | 58.6% | 54.5% | 53.8% |
| May 6 | 60.1% | 56.1% | 55.4% |
| May 7 | 61.6% | 57.6% | 57.0% |
KXL is still waiting for information from the Oregon Health Authority as to why these numbers are changing lower.
——————————————–
Portland, Ore. — On May 11th, Oregon Governor Kate Brown announced that counties in Oregon could apply to move to “LOWER RISK” level if the number of vaccinated people in the county was 65% or greater of eligible (16 and older) people. We took note of the number on the OHA Website that day. We focused on Washington and Multnomah Counties. The numbers were encouraging and growing at an average of 1.3% and 1.4% per day respectively. Because the OHA says that number for the last three days reported are not accurate because it takes time to report shots given, we looked at May 1st through May 7th.
In Washington County on May 7th, 60.2% of people had their first shot. In Multnomah County on May 7th, 61.6% of people had their first shot. The the average growth, both counties should have easily been above 65% by May 17th and when the numbers were first released in the morning, both counties had reached 65%. However in the afternoon the OHA says they had to revise the numbers because “In preparation of the update to our dashboards, to include 12-15 year olds, it was identified that youth younger than 16 years old were included in the 16-19 year-old categories. OHA identified this issue and republished our dashboards and the data mid-afternoon.”
But something is still not right and we looked at the numbers we recorded on May 11th and the numbers reported May 17th on the OHA website and here is what we found:
Washington County:
| Numbers from May 11th | Numbers from May 17th | Difference | |
| May 1, 2021 | 51.9% | 47.7% | -4.2% |
| May 2, 2021 | 53.0% | 48.9% | -4.1% |
| May 3, 2021 | 54.4% | 50.2% | -4.2% |
| May 4, 2021 | 56.0% | 51.8% | -4.2% |
| May 5, 2021 | 57.3% | 53.1% | -4.2% |
| May 6, 2021 | 59.0% | 54.9% | -4.1% |
| May 7, 2021 | 60.2% | 56.3% | -3.9% |
Multnomah County:
| Numbers from May 11th | Numbers from May 17th | Difference | |
| May 1, 2021 | 53.2% | 49.0% | -4.2% |
| May 2, 2021 | 54.4% | 50.2% | -4.2% |
| May 3, 2021 | 56.0% | 51.8% | -4.2% |
| May 4, 2021 | 57.4% | 53.2% | -4.2% |
| May 5, 2021 | 58.6% | 54.5% | -4.1% |
| May 6, 2021 | 60.1% | 56.1% | -4.0% |
| May 7, 2021 | 61.6% | 57.6% | -4.0% |
To put those percentages into real numbers, the eligible population of Washington county is 496,682. The 3.9% drop in numbers on May 7th equals approximately 19,370 less vaccinations reported than were reported last week. In Multnomah County the eligible population is 692,963. The 4% drop in numbers on May 7th equals approximately 27,718 less vaccinations. Together the two counties combined have a reduced number of vaccinated people on May 7th of 47,088.
Remember the OHA is blaming the drop in percentage on kids aged 12 to 15. Clearly this is not true.
All of this information was discovered late Monday afternoon. We requested an explanation from the OHA and were told, “Hi Jim: Thanks for follow up. We are working your request. To answer these questions, and given the time when they came in, we won’t be able to reply to you until tomorrow. Thank you for your patience.”
As of Monday night, the OHA listed Washington County at 64.1% vaccinated and Multnomah County at 64.7%. That means technically, both counties could be left out of being able to apply to move to lower risk.
KXL will follow up with the Oregon Health Authority on Tuesday to demand answers.


